Troubleshooting
How Much Water Should Be in a Water Softener Salt Tank?
Judge salt-tank water by the system model, fill sequence, and cycle stage. Use an observation sheet to separate normal changes from conditions needing support.
Salt & regeneration
Calculate an expected regeneration interval using water use, hardness, capacity, and reserve. Compare the estimate with a printable cycle log and model settings.
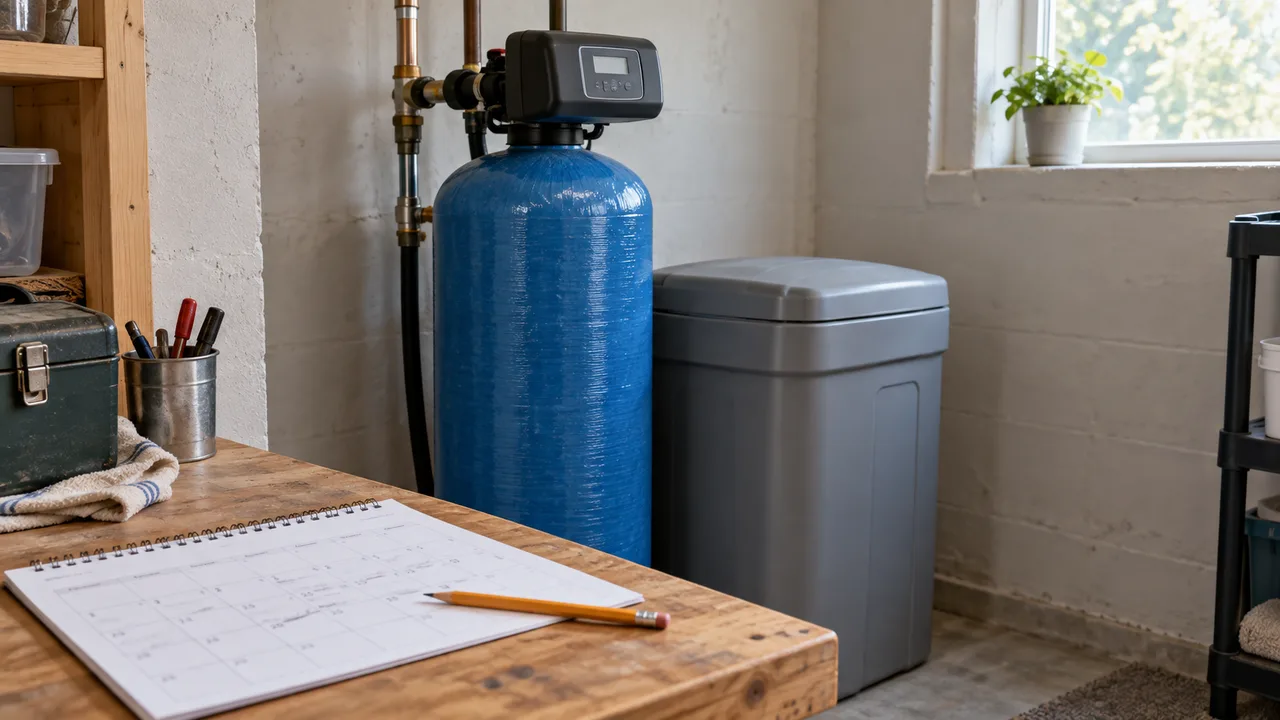
A water softener should regenerate according to the hardness it has treated and the way its controller is configured. There is no single weekly schedule that fits every home. You can estimate a capacity-limited interval from usable capacity, incoming hardness, and water that actually passes through the softener, then compare that estimate with a dated cycle record.
The calculation below is a way to ask better questions about your equipment. It is not a replacement for the controller's algorithm, a recommended timer setting, or an estimate of how long one regeneration takes.
Find the complete system model, its manual, and the current control mode before interpreting a calendar gap. A metered system responds to treated-water demand; a timer follows its programmed schedule. A delayed recharge may wait for its configured start time after the demand trigger.
The Pentair VT 5600SXT system manual illustrates why those distinctions matter: it separates capacity, hardness, reserve, regeneration time, and day override. Its override can trigger a metered unit even when usage has not reached the normal trigger. Those are model-specific settings, not instructions to copy into another controller.
Write down what your display actually says. If the operating mode is unknown, mark it unknown instead of assuming that a digital screen means demand-based control. Keep installer settings unchanged while building the record.
Use this worksheet for a simple single-capacity scenario. All numbers need a source, whether that is a meter reading, water test, or documented equipment specification.
| Input | Unit | What belongs here |
|---|---|---|
| Q: average softened water use | US gallons/day | Water passing through the softener; exclude confirmed bypassed use |
| H: incoming hardness | Grains per gallon, or GPG | A current incoming-water result, not the treated-water reading |
| C: working capacity | Grains | Capacity at the relevant salt dose and settings, confirmed for the complete system |
| R: separate reserve | Grains | Only reserve not already deducted from the capacity you entered |
A whole-house water bill may include outdoor water that never enters the softener. A controller's remaining-gallons display is also a different input from a full working-capacity specification. Label these numbers rather than using whichever one is easiest to find.
Ask the installer what a reserve value means before entering it. A volume reserve and a hardness-capacity reserve have different units. For this worksheet, an explicitly documented water-volume reserve can be expressed as grains by multiplying its gallons by the same incoming GPG. Do not subtract another reserve from a figure that already includes it.
If the water analysis includes iron or other treatment concerns, obtain the equipment-specific calculation. This worksheet does not invent a correction factor or establish whether the softener is suitable for that water.
First calculate the daily hardness load:
Daily load = Q × H
Then estimate how long the capacity available before a separate reserve is used would last:
Estimated days = (C − R) ÷ (Q × H)
Here is a hypothetical example, not a measured household or equipment rating:
The daily load is 180 × 15 = 2,700 grains/day. Available capacity is 24,000 − 3,000 = 21,000 grains. Dividing gives 21,000 ÷ 2,700 = about 7.8 days.
That result explains a capacity relationship. It does not tell you to enter eight days in the controller. A delayed trigger, changing daily demand, or an override can produce a different observed interval.
The following scenarios keep the same assumed 24,000-grain working capacity and 3,000-grain separate reserve.
| Scenario | Softened use | Hardness | Daily load | Capacity-only interval |
|---|---|---|---|---|
| Starting example | 180 gal/day | 15 GPG | 2,700 grains/day | About 7.8 days |
| More softened water | 240 gal/day | 15 GPG | 3,600 grains/day | About 5.8 days |
| Harder incoming water | 180 gal/day | 20 GPG | 3,600 grains/day | About 5.8 days |
These are sensitivity examples, not three recommended schedules. They show why a shorter interval can follow a real change in load without proving that the equipment is defective.
For the reverse question—how much working capacity a chosen interval would require—use the working-capacity calculator. Enter your own softened use and hardness, and choose only one reserve method. Take the resulting assumptions to the supplier rather than matching the result directly to a marketing capacity label.
Record completed events, not just the time displayed for the next possible recharge. Note manual cycles separately so a service visit does not look like a change in automatic demand.
Rheem's recharge-frequency guide explains a diagnostic counter that includes automatic and manual recharges. Its days-in-service calculation gives a lifetime average. To investigate a recent change, a clearly defined observation window is more useful than blending it with years of earlier use.
For example, if an unchanged counter goes from 120 to 124 over 28 elapsed days, four cycles occurred in that window. 28 ÷ 4 = 7 days per cycle is the window's average. It does not mean every gap lasted seven days. If there are no cycles in the window, record zero events; do not divide by zero or invent an interval.
Use the page's Print button to keep this record near the manual:
| Observation | Your entry |
|---|---|
| Start date/time and cycle counter | ____________________ |
| End date/time and cycle counter | ____________________ |
| Dates of individually observed cycles | ____________________ |
| Automatic, manual, or unknown | ____________________ |
| Softened water use during the window | ____________________ |
| Guests, leaks, travel, or other use changes | ____________________ |
| Incoming hardness and test date | ____________________ |
| Treated-water result and sampling conditions | ____________________ |
| Current mode, override, or service change | ____________________ |
For successive observations, keep the same counter and record any reset. If a counter decreases, the simple difference is not a valid cycle count without explaining the reset or rollover.
The interval shortened after higher use. Compare treated gallons over the same time window. Guests or newly softened outdoor use can change the load represented by Q. Recalculate with that evidence before treating the old interval as a target.
The interval shortened without an explained change. Record the hardness setting, possible unaccounted water use, and any maximum-days feature. These are also the main checks in Rheem's guide to unusually frequent recharges. Use the matching model instructions to inspect them; do not disable an override whose purpose you do not know.
The interval grew longer. Compare demand and the treated-water result. A quiet controller during a low-use period means something different from a long gap accompanied by unexpected hardness. If the evidence does not fit the documented operation, give the manufacturer the log, model, current display, and any recent setting changes.
The schedule is regular but performance is poor. The occurrence of a cycle does not by itself establish successful treatment. Keep the observed interval separate from the outcome of the cycle. Changing the schedule alone may leave the original problem unexplained.
A cycle count is only one part of an operating-cost comparison. A proposal to lengthen the interval needs a corresponding working capacity, salt dose, regeneration-water amount, and acceptable treatment result. Otherwise it changes the calendar without giving you enough information to compare costs.
Use the running-cost calculator with documented cycle details or actual spending records. Keep hypothetical settings separate from observations. A more useful question for the supplier is: “At the capacity and salt dose you propose, what interval and treated-water result should I expect with these inputs?” That creates a prediction you can later check.
A nightly event cannot be judged from the calendar alone. Check the control mode, recorded treated-water demand, and any documented maximum-days setting. Compare those with the working-capacity estimate and actual treated-water results. If the pattern changed without a matching change in use or settings, preserve the observations and ask the manufacturer to interpret them before adjusting the schedule.
A seven-day interval can fit some combinations of demand and available capacity, but it is not a target for every household. In the hypothetical example here, different inputs produce different intervals without changing the equipment. Use measured softened water use and incoming hardness, confirm the capacity assumptions, and compare several dated observations rather than judging one gap in isolation.
Only if you can establish that the advertised figure represents the working capacity at the actual operating conditions being evaluated. Ask for the relevant salt dose and clarify whether reserve has already been allowed for. A nominal capacity, remaining-gallons display, and reserve value are not interchangeable numbers. If those details are unknown, label the estimate incomplete rather than filling the gaps with guesses.
The worksheet divides a fixed assumed capacity by an average daily load. Real daily use can vary, and the controller may apply a delayed start, reserve logic, or another documented trigger. Check that the inputs describe the same conditions before comparing results. A difference identifies assumptions to investigate; it does not automatically prove that the controller is miscalculating or that a setting needs changing.
Do not infer that from this frequency calculation. Record routine salt additions separately from manual cycles, and use the model's refill or recovery instructions to decide whether an extra cycle is required. A manual event changes the observed cycle count, so note its reason and date. That keeps later comparisons of automatic behavior from being distorted by maintenance actions.
Troubleshooting
Judge salt-tank water by the system model, fill sequence, and cycle stage. Use an observation sheet to separate normal changes from conditions needing support.
Salt & regeneration
Choose a model-appropriate refill level, record the salt actually added, and estimate your replenishment needs without a universal bags-per-month rule.
Maintenance
Build a practical water softener care routine with model-specific checks, a printable maintenance log, and clear guidance on salt, hardness testing, and service.