Maintenance
Water Softener After a Power Outage: What Settings Should You Check?
Check your softener clock, retained programming and interrupted-cycle status after an outage, with model-specific examples and a printable recovery record.
Salt & regeneration
Compare Rheem, GE, and Fleck regeneration stages, then use a printable timeline to measure when your own water softener returns to service.

A water softener's regeneration time depends on the complete system and its current cycle settings. For one named comparison, Rheem says its described recharge averages 2 to 2½ hours; that is a planning figure for those units, not a deadline for every softener. Find your model's manual, note when the controller starts its cycle, and record when it returns to service. The stage log below helps you compare an actual cycle with the instructions for your equipment.
Manufacturers do not even use one stage order. Rheem's recharge explanation describes fill first, followed by brine draw and rinse, backwash, and a final rinse. It gives about 5–15 minutes for fill, around two hours for brining, about 6–12 minutes for backwash, and about 2–3 minutes for the final rinse. Rheem also describes an optional clean cycle that can add a backwash and rinse before recharge. Those figures are approximate descriptions of its process; adding the endpoints of the ranges is not a reliable clock for another model.
GE Appliances' five-stage explanation likewise starts with fill, but says stage times can change almost every recharge as the system responds to water use and forecast demand. It describes brining as taking about 30–100 minutes on the equipment covered by that page. It gives no single whole-cycle total, so that stage range cannot be treated as the full time.
The Pentair Fleck 5600SXT downflow service manual shows a different order: backwash, brine draw with slow rinse, rapid rinse, then brine refill. Its controller displays the current step and time remaining in that step. The manual says step times are programmable and notes that upflow or filter configurations can use another sequence. It does not supply one total duration for every installed 5600SXT system.
Stage names describe functions, but their order depends on the system:
These names are a vocabulary guide, not a prescribed sequence. Do not advance stages or copy a time setting from another brand to make the display finish sooner.
Write down the full system model and, if separately identified, the valve or controller model. Use the manual that matches that configuration. On the Fleck controller described above, “regeneration time” is the hour a delayed cycle begins, not its length; the countdown can show only the current step.
Use Print this page and fill in the record while the controller runs normally. Record what you can observe without opening the valve, disconnecting a drain, or changing settings. Add another line if a stage repeats or your display uses different names.
System model: ________ Valve/controller: ________ Manual or support page: ________ Optional clean cycle enabled? ________
Cycle date: ________ Cycle began: ________ Returned to service: ________ Total observed elapsed time: ________
Returned to service at: ________ Final observation: ________
The elapsed time is the difference between the observed start and return-to-service times, including any pauses and transitions. If you did not see the start or finish, mark that gap instead of calculating a precise total. Keep a photo of any error message and of the normal settings if you need to speak with support.
Compare your record with the same model's manual or manufacturer support page. Confirm the stage order, any optional clean cycle, and whether a displayed number is for one stage. A quiet period is not proof that regeneration has finished; use the controller's return-to-service indication and the manual's completion guidance.
If a stage appears not to advance, an error appears, or the unit has not returned to service after the model-specific time you expected, note the exact stage and elapsed time and contact the manufacturer, installer, or service provider for that model. A longer-than-expected record alone does not identify a blocked drain, failed brine draw, or bad valve. It is more useful to report where the cycle stopped than to describe it only as “running all night.”
Once the cycle has finished, duration and water quality become separate checks. If treated water still tests hard, the post-regeneration hardness diagnostic explains how to sample known treated cold outlets and record the pattern before blaming the cycle. The system may have completed its displayed sequence without resolving the water problem.
“How long did this regeneration run?” measures one event from start to return to service. “How often does it regenerate?” measures the time between events. Demand, working capacity, reserve, and a controller's schedule can alter that interval without changing every stage timer. If the concern is that your unit regenerates too frequently or not often enough, use the regeneration interval calculator and cycle log. Keep the two measurements on separate lines in your notes.
One complete observation gives you a baseline for that configuration. If the next cycle differs, check what changed before labeling either one faulty: an optional clean cycle, the displayed stage sequence, or settings documented for your exact controller. Manufacturer guidance also shows that some systems vary stage times with demand, so repeated records are more informative than borrowing a generic number.
If the difference matters to your household, take the two dated logs and the matching manual to the installer or manufacturer. Ask which stage or setting explains it and what a normal return-to-service indication should look like. That keeps a timing question focused on evidence you can collect safely.
It is a useful comparison for some named systems, not a universal pass/fail line. Rheem describes an average of two to two and a half hours for the recharge process on the equipment covered by its support page. Other controllers use different sequences or adjustable step times. Check your complete system model and its manual, then measure from the observed start until the controller returns to service. A single number found for another brand cannot establish whether your cycle is normal.
Brine draw and its slow rinse can occupy much of a cycle, but the time depends on the design and settings. Rheem describes its brining portion as around two hours; GE gives a broad brining range for the systems covered by its page. Those manufacturer figures should not be transferred to a different valve. Record the stage labels and actual times on your controller, then compare each stage with its own manual instead of judging the whole cycle by one long step.
Do not assume it does. Pentair's Fleck 5600SXT downflow manual says its regeneration display identifies the current step and the time remaining in that step. The controller then moves through later programmed steps before returning to service. Another model may use different labels or a different display. Consult the matching manual, note each transition, and use the actual return-to-service indication as your end point. A changing number without its stage label can be misleading.
First check whether the cycle is actually still active and whether your model has an optional stage. Record the system model, current display or error, stage, start time, and any transition you observed. Compare that record with the exact manual or ask the manufacturer or installer to interpret it. Do not skip to the next stage, reset the control, or change timing just to shorten the run. Elapsed time by itself cannot identify which component, if any, needs service.
Duration is the length of one cycle; frequency is how much time passes before another cycle begins. A metered or scheduled controller may change the interval because treated-water demand, reserve, or its trigger changed. That does not mean the brine or rinse stage necessarily lasts longer. Record a cycle's start and return-to-service time for duration, and record the dates of completed cycles for frequency. Separate logs let you ask the right question when the equipment seems to run too often.
Maintenance
Check your softener clock, retained programming and interrupted-cycle status after an outage, with model-specific examples and a printable recovery record.
Maintenance
Choose a model-appropriate vacation plan, record power and valve positions, separate freezing-weather preparation, and check the return to service.
Salt & regeneration
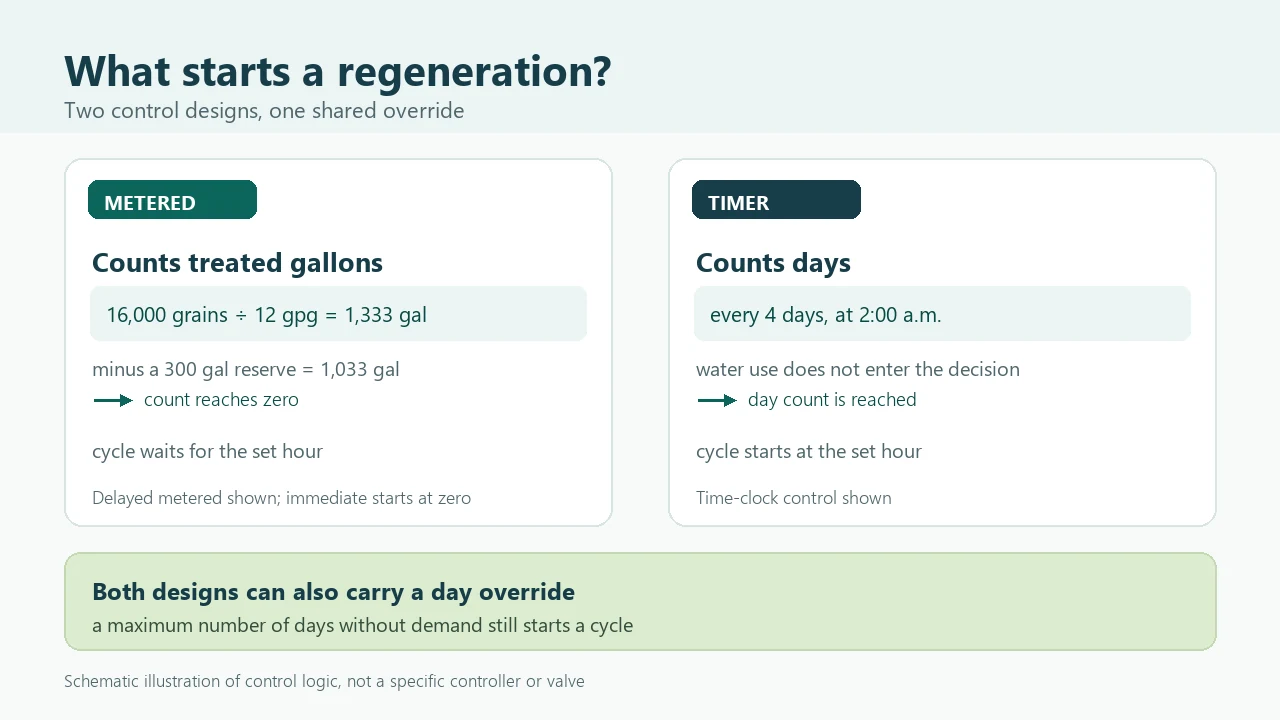
Compare how metered and time-clock softener controls decide when to regenerate, with the immediate and delayed trigger paths, a shared day override, and worked gallons arithmetic for two usage patterns.
Salt & regeneration
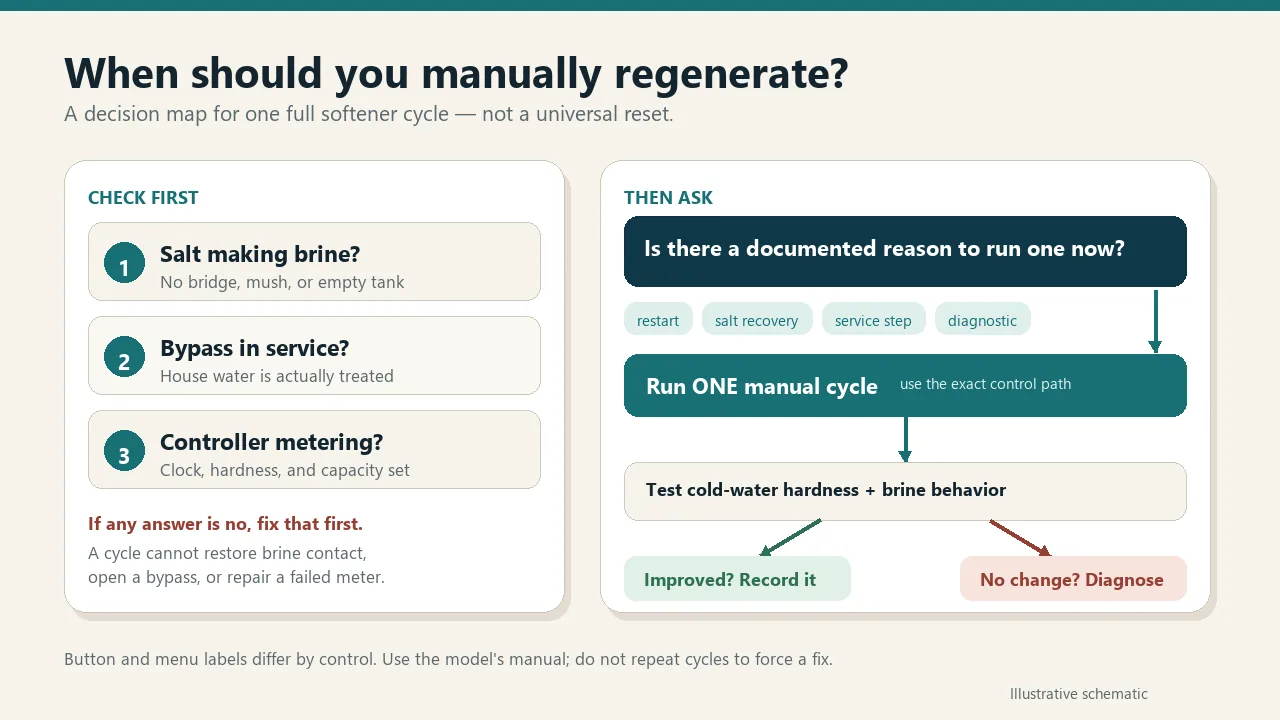
Decide when a manual softener regeneration is justified, compare Whirlpool, EcoWater, and Fleck control paths, and know when to stop and diagnose instead.
Sizing & costs
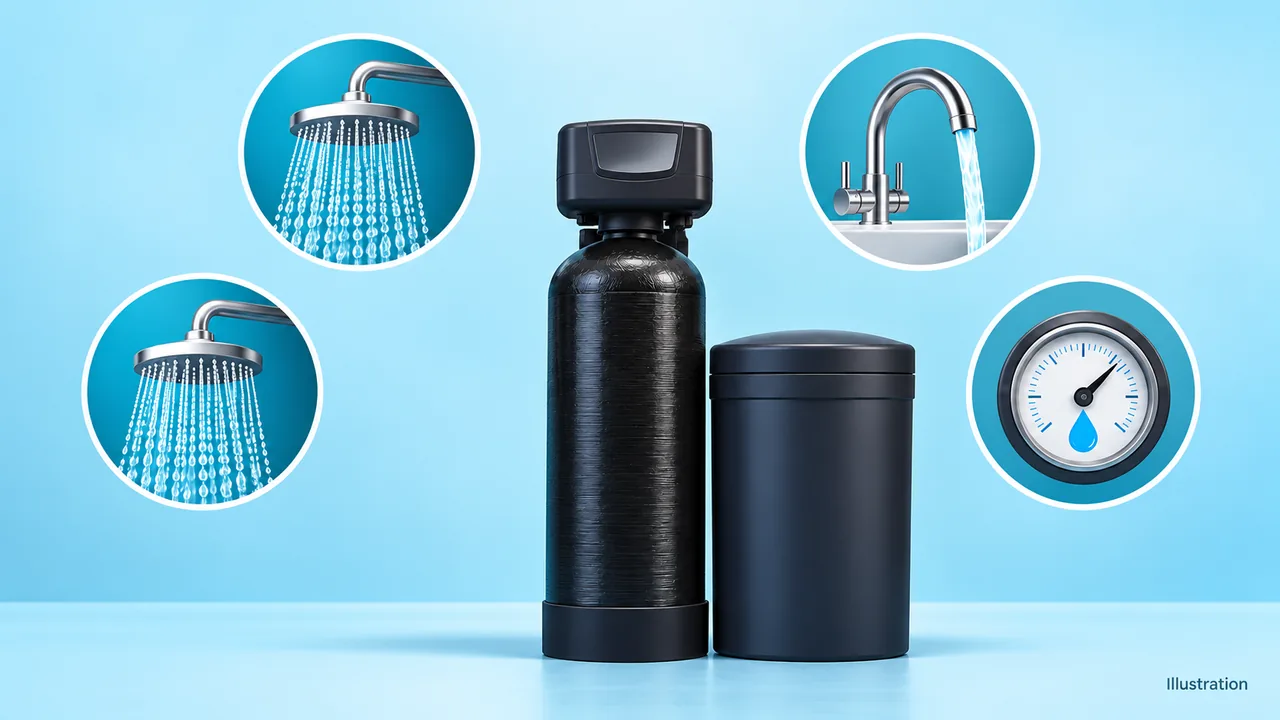
Estimate simultaneous household flow, compare it with a model-specific service-flow rating and pressure drop, and record the evidence before choosing a water softener.
Troubleshooting
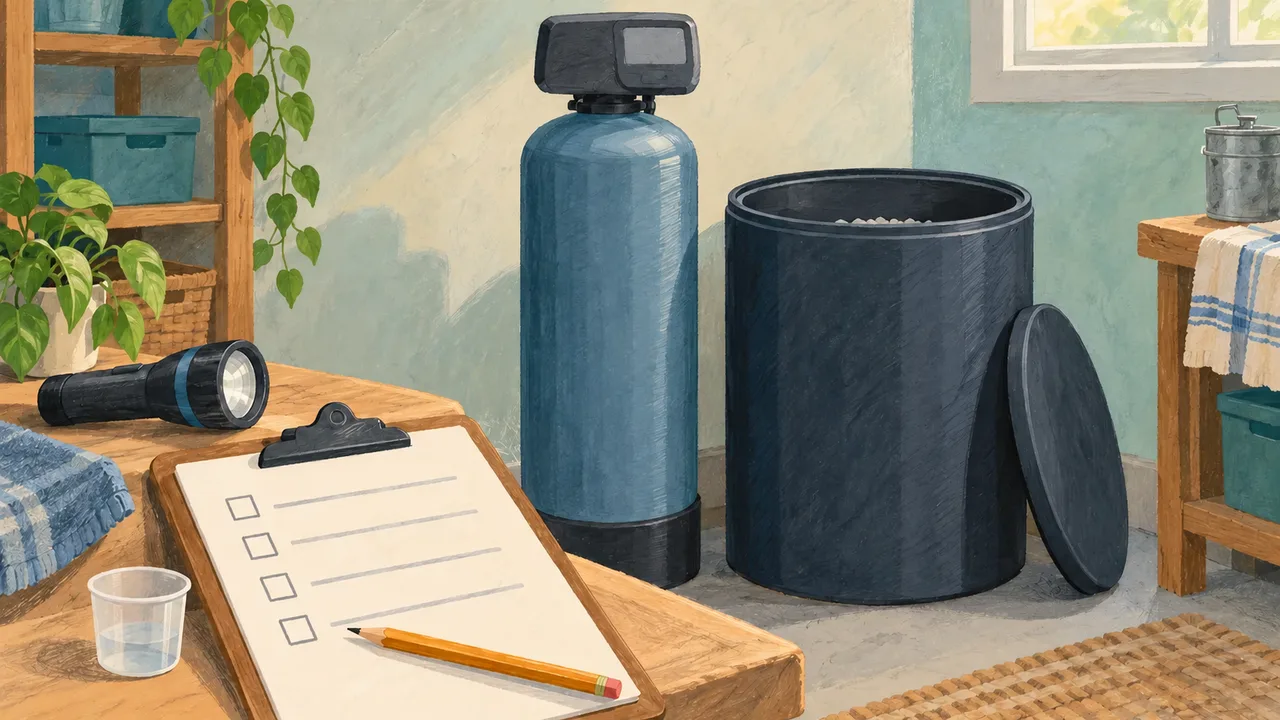
Use an observation-first checklist to find why a water softener is not using salt, then separate salt bridges, metering, bypass, fill, and brine-draw questions.